
-
Total revenues of
$130.1 million , an increase of 8.4% from the prior year quarter -
Net income attributable to
Textainer Group Holdings Limited common shareholders of$48.8 million , an increase of 6.6% from the prior year quarter -
Adjusted EBITDA(1) of
$106.2 million , an increase of 14.6% from the prior year quarter
“The second quarter was marked by attractive growth in both our lease
rental income and net income,” commented
“Total capex ordered for delivery in 2013 was
“Although the demand for containers improved in the second quarter, we continue to see compression of returns due to the high level of liquidity among container lessors and the ease with which containers can be purchased at factories. We expect these market conditions to continue for the near term. We are also expecting a muted peak season with utilization remaining near today’s levels as the market stabilizes,” added Mr. Brewer.
Business Highlights:
-
Continued strong pace of expansion, investing
$494 million in new and used containers year-to-date following$198 million invested in new containers in the fourth quarter of 2012 for lease outs in 2013; - Total fleet size grew by 9.4% to 2.9 million TEU, given the strong pace of investment over the past year;
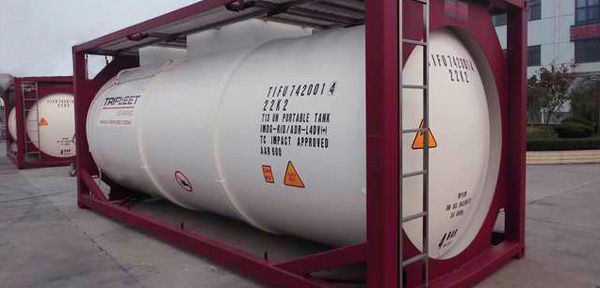
- Announced a collaboration with Trifleet allowing expansion into tank leasing with one of the leaders in the industry;
- Reduced our average effective interest rate (which includes interest rate swaps) by 145 basis points year-over-year and by 34 basis points compared to the prior quarter, while increasing the size of several financing facilities;
- Achieved average utilization of 94.7% during the quarter and 94.3% currently; and
-
Increased dividend to
$0.47 per share, resulting in the Company’s fourteenth consecutive quarterly increase.
|
Key Financial Information (in thousands except for per share and TEU amounts): |
|||||||||||||||||
| Q2 QTD | Q2 YTD | ||||||||||||||||
| 2013 | 2012 | % Change | 2013 | 2012 | % Change | ||||||||||||
| Total revenues | $ | 130,084 | $ | 119,990 | 8.4% | $ | 258,847 | $ | 237,505 | 9.0% | |||||||
| Income from operations | $ | 72,061 | $ | 69,245 | 4.1% | $ | 148,131 | $ | 137,225 | 7.9% | |||||||
| Net income attributable to Textainer Group Holdings Limited common shareholders | $ | 48,815 | $ | 45,809 | 6.6% | $ | 97,149 | $ | 95,719 | 1.5% | |||||||
| Net income attributable to Textainer Group Holdings Limited common shareholders per diluted common share | $ | 0.86 | $ | 0.91 | -5.5% | $ | 1.71 | $ | 1.90 | -10.0% | |||||||
| Adjusted net income(1) | $ | 45,668 | $ | 44,674 | 2.2% | $ | 91,790 | $ | 93,516 | -1.8% | |||||||
| Adjusted net income per diluted common share(1) | $ | 0.80 | $ | 0.89 | -10.1% | $ | 1.61 | $ | 1.85 | -13.0% | |||||||
| Adjusted EBITDA(1) | $ | 106,227 | $ | 92,698 | 14.6% | $ | 214,767 | $ | 183,052 | 17.3% | |||||||
| Average fleet utilization | 94.7% | 97.5% | -2.9% | 95.1% | 97.2% | -2.2% | |||||||||||
| Total fleet size at end of period (TEU) | 2,860,549 | 2,615,282 | 9.4% | ||||||||||||||
| Owned percentage of total fleet at end of period | 74.0% | 60.4% | 22.5% | ||||||||||||||
“Adjusted net income” and “adjusted EBITDA” are Non-GAAP Measures that
are reconciled to GAAP measures in footnote 1. “Adjusted net income” is
defined as net income attributable to
Second Quarter Results:
Textainer’s financial results benefited from a 33.9% increase in the
size of the owned container fleet in the second quarter of 2013,
compared to the year ago quarter, offset by incremental increases in
depreciation expense and direct container expense due to the larger
owned container fleet and lower utilization.
During the second quarter,
Outlook
“While we have made robust investments over the past twelve months and our fleet continues to grow, demand has been softer than expected due to lower than projected trade growth and the inability to successfully implement and maintain general freight rate increases,” stated Mr. Brewer. “While we experienced an increase in demand in June and July, we believe the peak season will be subdued and the competitive dynamics of our industry will contribute to a similar earnings environment during the second half of 2013 as during the first half.
“We expect that total new container production will be substantially below the level of 2012, and that lessors will purchase around 50% of total output. New container prices have declined steadily since March and are at levels not seen since early 2010. We do not expect to see new container prices rise significantly from their current levels during the remainder of the year. Used container prices have fallen by approximately 10% over the last twelve months and additional declines are possible. We expect to see an increasing number of purchase leaseback opportunities, but pricing for such deals is equally as competitive as for new equipment lease-outs. Additionally, although we are just getting started, we are excited about the opportunity to work with Trifleet to expand into the tank market,” concluded Mr. Brewer.
Dividend
On
“We increased our dividend by
Investors’ Webcast
About
Important Cautionary Information Regarding Forward-Looking Statements
This press release contains forward-looking statements within the
meaning of U.S. securities laws. Forward-looking statements include
statements that are not statements of historical facts and include,
without limitation, statements regarding: (i) Textainer’s belief that
certain market conditions, such as compressed returns of containers due
to the high level of liquidity among container lessors and the ease with
which containers can be purchased at factories, will continue for the
near term; (ii) Textainer’s expectation of a muted peak season with
utilization remaining near today’s levels as the market stabilizes;
(iii) Textainer’s belief that the peak season will be subdued and the
competitive dynamics of its industry will contribute to a similar
earnings environment during the second half of 2013 as during the first
half; (iv) Textainer’s expectation that a total new container production
will be substantially below the level of 2012, and that lessors will
purchase around 50% of total output; (v) Textainer’s expectation that
new container prices will not rise significantly from their current
levels during the remainder of the year; (vi) Textainer’s belief that
additional declines in used container prices are possible; and (vii)
Textainer’s expectation that it will see an increasing number of
purchase leaseback opportunities, but that pricing for such deals will
be equally as competitive as for new equipment lease-outs. Readers are
cautioned that these forward-looking statements involve risks and
uncertainties, are only predictions and may differ materially from
actual future events or results. These risks and uncertainties include,
without limitation, the following items that could materially and
negatively impact our business, results of operations, cash flows,
financial condition and future prospects: any deceleration or reversal
of the current domestic and global economic recoveries; lease rates may
decrease and lessees may default, which could decrease revenue and
increasing storage, repositioning, collection and recovery expenses; we
own a large and growing number of containers in our fleet and are
subject to significant ownership risk; further consolidation of
container manufacturers or the disruption of manufacturing for the major
manufacturers could result in higher new container prices and/or
decreased supply of new containers and any increase in the cost or
reduction in the supply of new containers; the demand for leased
containers depends on many political and economic factors beyond
| TEXTAINER GROUP HOLDINGS LIMITED AND SUBSIDIARIES | |||||||||||||||||||||||||||
| Condensed Consolidated Statements of Comprehensive Income | |||||||||||||||||||||||||||
| Three and Six Months Ended June 30, 2013 and 2012 | |||||||||||||||||||||||||||
| (Unaudited) | |||||||||||||||||||||||||||
| (All currency expressed in United States dollars in thousands, except per share amounts) | |||||||||||||||||||||||||||
| Three Months Ended June 30, | Six Months Ended June 30, | ||||||||||||||||||||||||||
| 2013 | 2012 | 2013 | 2012 | ||||||||||||||||||||||||
| Revenues: | |||||||||||||||||||||||||||
| Lease rental income | $ | 115,370 | $ | 91,791 | $ | 228,597 | $ | 179,679 | |||||||||||||||||||
| Management fees | 4,949 | 7,293 | 10,232 | 14,094 | |||||||||||||||||||||||
| Trading container sales proceeds | 2,102 | 12,744 | 4,895 | 24,281 | |||||||||||||||||||||||
|
Gains on sale of containers, net |
7,663 | 8,162 | 15,123 | 19,451 | |||||||||||||||||||||||
| Total revenues | 130,084 | 119,990 | 258,847 | 237,505 | |||||||||||||||||||||||
| Operating expenses: | |||||||||||||||||||||||||||
| Direct container expense | 10,134 | 6,104 | 19,138 | 12,164 | |||||||||||||||||||||||
| Cost of trading containers sold | 1,745 | 11,130 | 4,210 | 21,132 | |||||||||||||||||||||||
| Depreciation expense | 33,833 | 22,801 | 66,516 | 44,381 | |||||||||||||||||||||||
| Amortization expense | 1,088 | 1,299 | 2,175 | 2,605 | |||||||||||||||||||||||
| General and administrative expense | 6,167 | 5,822 | 12,604 | 11,545 | |||||||||||||||||||||||
| Short-term incentive compensation expense | 685 | 1,322 | 1,372 | 2,314 | |||||||||||||||||||||||
| Long-term incentive compensation expense | 1,134 | 1,524 | 2,214 | 3,678 | |||||||||||||||||||||||
| Bad debt expense, net | 3,237 | 743 | 2,487 | 2,461 | |||||||||||||||||||||||
| Total operating expenses | 58,023 | 50,745 | 110,716 | 100,280 | |||||||||||||||||||||||
| Income from operations | 72,061 | 69,245 | 148,131 | 137,225 | |||||||||||||||||||||||
| Other income (expense): | |||||||||||||||||||||||||||
| Interest expense | (20,894 | ) | (18,531 | ) | (42,523 | ) | (33,250 | ) | |||||||||||||||||||
| Interest income | 31 | 35 | 69 | 63 | |||||||||||||||||||||||
| Realized losses on interest rate swaps and caps, net | (2,089 | ) | (2,529 | ) | (4,479 | ) | (5,079 | ) | |||||||||||||||||||
| Unrealized gains on interest rate swaps and caps, net | 3,981 | 1,025 | 6,268 | 2,073 | |||||||||||||||||||||||
| Other, net | (10 | ) | (1 | ) | (29 | ) | (2 | ) | |||||||||||||||||||
| Net other expense | (18,981 | ) | (20,001 | ) | (40,694 | ) | (36,195 | ) | |||||||||||||||||||
| Income before income tax and noncontrolling interest | 53,080 | 49,244 | 107,437 | 101,030 | |||||||||||||||||||||||
| Income tax expense | (2,240 | ) | (4,122 | ) | (6,781 | ) | (6,445 | ) | |||||||||||||||||||
| Net income | 50,840 | 45,122 | 100,656 | 94,585 | |||||||||||||||||||||||
| Less: Net (income) loss attributable to the noncontrolling interest | (2,025 | ) | 687 | (3,507 | ) | 1,134 | |||||||||||||||||||||
|
Net income attributable to Textainer Group Holdings Limited common shareholders |
$ | 48,815 | $ | 45,809 | $ | 97,149 | $ | 95,719 | |||||||||||||||||||
|
Net income attributable to Textainer Group Holdings Limited common shareholders per share: |
|||||||||||||||||||||||||||
| Basic | $ | 0.87 | $ | 0.92 | $ | 1.73 | $ | 1.93 | |||||||||||||||||||
| Diluted | $ | 0.86 | $ | 0.91 | $ | 1.71 | $ | 1.90 | |||||||||||||||||||
| Weighted average shares outstanding (in thousands): | |||||||||||||||||||||||||||
| Basic | 56,298 | 49,543 | 56,266 | 49,484 | |||||||||||||||||||||||
| Diluted | 56,875 | 50,358 | 56,840 | 50,442 | |||||||||||||||||||||||
| Other comprehensive income: | |||||||||||||||||||||||||||
| Foreign currency translation adjustments | (37 | ) | (72 | ) | (134 | ) | 5 | ||||||||||||||||||||
| Comprehensive income | 50,803 | 45,050 | 100,522 | 94,590 | |||||||||||||||||||||||
|
Comprehensive (income) loss attributable to the noncontrolling interest |
(2,025 | ) | 687 | (3,507 | ) | 1,134 | |||||||||||||||||||||
|
Comprehensive income attributable to Textainer Group Holdings Limited common shareholders |
$ | 48,778 | $ | 45,737 | $ | 97,015 | $ | 95,724 | |||||||||||||||||||
| TEXTAINER GROUP HOLDINGS LIMITED AND SUBSIDIARIES | |||||||
| Condensed Consolidated Balance Sheets | |||||||
| June 30, 2013 and December 31, 2012 | |||||||
| (Unaudited) | |||||||
| (All currency expressed in United States dollars in thousands) | |||||||
| 2013 | 2012 | ||||||
| Assets | |||||||
| Current assets: | |||||||
| Cash and cash equivalents | $ | 92,755 | $ | 100,127 | |||
|
Accounts receivable, net of allowance for doubtful accounts of $9,455 and $8,025 in 2013 and 2012, respectively |
95,543 | 94,102 | |||||
| Net investment in direct financing and sales-type leases | 58,713 | 43,253 | |||||
| Trading containers | 19,059 | 7,296 | |||||
| Containers held for sale | 27,661 | 15,717 | |||||
| Prepaid expenses | 11,929 | 14,006 | |||||
| Deferred taxes | 2,299 | 2,332 | |||||
| Due from affiliates, net | 3 | 4,377 | |||||
| Total current assets | 307,962 | 281,210 | |||||
| Restricted cash | 46,010 | 54,945 | |||||
|
Containers, net of accumulated depreciation of $502,246 and $490,930 at 2013 and 2012, respectively |
3,020,035 | 2,916,673 | |||||
| Net investment in direct financing and sales-type leases | 218,498 | 173,634 | |||||
|
Fixed assets, net of accumulated depreciation of $8,484 and $9,189 at 2013 and 2012, respectively |
1,641 | 1,621 | |||||
|
Intangible assets, net of accumulated amortization of $29,137 and $26,963 at 2013 and 2012, respectively |
31,208 | 33,383 | |||||
| Interest rate swaps and caps | 811 | - | |||||
| Other assets | 16,265 | 14,614 | |||||
| Total assets | $ | 3,642,430 | $ | 3,476,080 | |||
| Liabilities and Equity | |||||||
| Current liabilities: | |||||||
| Accounts payable | $ | 6,951 | $ | 4,451 | |||
| Accrued expenses | 9,373 | 14,329 | |||||
| Container contracts payable | 23,988 | 87,708 | |||||
| Deferred revenue and other | 428 | 1,681 | |||||
| Due to owners, net | 13,661 | 13,218 | |||||
| Bonds payable | 131,500 | 131,500 | |||||
| Total current liabilities | 185,901 | 252,887 | |||||
| Revolving credit facilities | 797,061 | 549,911 | |||||
| Secured debt facility | 870,100 | 874,000 | |||||
| Bonds payable | 640,542 | 706,291 | |||||
| Interest rate swaps and caps | 5,362 | 10,819 | |||||
| Income tax payable | 16,645 | 27,580 | |||||
| Deferred taxes | 19,335 | 5,249 | |||||
| Other liabilities | 3,304 | 3,210 | |||||
| Total liabilities | 2,538,250 | 2,429,947 | |||||
| Equity: | |||||||
| Textainer Group Holdings Limited shareholders' equity: | |||||||
|
Common shares, $0.01 par value. Authorized 140,000,000 shares; issued and outstanding 56,316,678 and 55,754,529 at 2013 and 2012, respectively |
563 | 558 | |||||
| Additional paid-in capital | 361,339 | 354,448 | |||||
| Accumulated other comprehensive income | (20 | ) | 114 | ||||
| Retained earnings | 698,323 | 652,383 | |||||
| Total Textainer Group Holdings Limited shareholders’ equity | 1,060,205 | 1,007,503 | |||||
| Noncontrolling interest | 43,975 | 38,630 | |||||
| Total equity | 1,104,180 | 1,046,133 | |||||
| Total liabilities and equity | $ | 3,642,430 | $ | 3,476,080 | |||
| TEXTAINER GROUP HOLDINGS LIMITED AND SUBSIDIARIES | ||||||||
| Condensed Consolidated Statements of Cash Flows | ||||||||
| Six Months Ended June 30, 2013 and 2012 | ||||||||
| (Unaudited) | ||||||||
| (All currency expressed in United States dollars in thousands) | ||||||||
| Six Months Ended | ||||||||
|
June 30, |
||||||||
| 2013 | 2012 | |||||||
| Cash flows from operating activities: | ||||||||
| Net income | $ | 100,656 | $ | 94,585 | ||||
| Adjustments to reconcile net income to net cash provided by operating activities: | ||||||||
| Depreciation expense | 66,516 | 44,381 | ||||||
| Bad debt expense, net | 2,487 | 2,461 | ||||||
| Unrealized gains on interest rate swaps and caps, net | (6,268 | ) | (2,073 | ) | ||||
| Amortization of debt issuance costs | 5,985 | 6,370 | ||||||
| Amortization of intangible assets | 2,175 | 2,605 | ||||||
| Amortization of acquired net below-market leases | - | (33 | ) | |||||
| Amortization of deferred revenue | (970 | ) | (4,532 | ) | ||||
| Amortization of unearned income on direct financing and sales-type leases | (10,679 | ) | (5,407 | ) | ||||
| Gains on sale of containers, net | (15,123 | ) | (19,451 | ) | ||||
| Share-based compensation expense | 2,557 | 4,190 | ||||||
| Changes in operating assets and liabilities | (10,284 | ) | (14,571 | ) | ||||
| Total adjustments | 36,396 | 13,940 | ||||||
| Net cash provided by operating activities | 137,052 | 108,525 | ||||||
| Cash flows from investing activities: | ||||||||
| Purchase of containers and fixed assets | (376,002 | ) | (316,021 | ) | ||||
| Proceeds from sale of containers and fixed assets | 58,678 | 47,563 | ||||||
| Receipt of principal payments on direct financing and sales-type leases | 37,240 | 18,157 | ||||||
| Net cash used in investing activities | (280,084 | ) | (250,301 | ) | ||||
| Cash flows from financing activities: | ||||||||
| Proceeds from revolving credit facilities | 258,368 | 150,530 | ||||||
| Principal payments on revolving credit facilities | (11,218 | ) | (123,993 | ) | ||||
| Proceeds from secured debt facility | 34,100 | 654,000 | ||||||
| Principal payments on secured debt facility | (38,000 | ) | (832,697 | ) | ||||
| Proceeds from bonds payable | - | 400,000 | ||||||
| Principal payments on bonds payable | (65,749 | ) | (52,418 | ) | ||||
| Decrease (increase) in restricted cash | 8,935 | (770 | ) | |||||
| Debt issuance costs | (5,610 | ) | (18,500 | ) | ||||
| Issuance of common shares upon exercise of share options | 2,048 | 3,763 | ||||||
| Excess tax benefit from share-based compensation awards | 2,291 | 2,707 | ||||||
| Capital contributions from noncontrolling interest | 1,838 | 4,589 | ||||||
| Dividends paid | (51,209 | ) | (38,104 | ) | ||||
| Net cash provided by financing activities | 135,794 | 149,107 | ||||||
| Effect of exchange rate changes | (134 | ) | 5 | |||||
| Net (decrease) increase in cash and cash equivalents | (7,372 | ) | 7,336 | |||||
| Cash and cash equivalents, beginning of the year | 100,127 | 74,816 | ||||||
| Cash and cash equivalents, end of period | $ | 92,755 | $ | 82,152 | ||||
TEXTAINER GROUP HOLDINGS LIMITED AND SUBSIDIARIES
Reconciliation
of GAAP financial measures to non-GAAP financial measures
Three and
Six Months Ended
(Unaudited)
(All
currency expressed in
(1) The following is a reconciliation of certain GAAP measures to
non-GAAP financial measures (such items listed in (a) to (d) below and
defined as “Non-GAAP Measures”) for the three and six months ended
(a) net income attributable to
(b) net cash provided by operating activities to Adjusted EBITDA;
(c) net income attributable to Textainer Group Holdings Limited common
shareholders to adjusted net income (defined as net income attributable
to
(d) net income attributable to
Non-GAAP Measures are not financial measures calculated in accordance
with U.S. generally accepted accounting principles ("GAAP") and should
not be considered as an alternative to net income, income from
operations or any other performance measures derived in accordance with
GAAP or as an alternative to cash flows from operating activities as a
measure of our liquidity. Non-GAAP Measures are presented solely as
supplemental disclosures. Management believes that adjusted EBITDA may
be a useful performance measure that is widely used within our industry
and adjusted net income may be a useful performance measure because
Management also believes that adjusted net income and adjusted net income per diluted common share are useful in evaluating our operating performance because unrealized (gains) losses on interest rate swaps and caps, net is a noncash, non-operating item. We believe Non-GAAP Measures provide useful information on our earnings from ongoing operations. We believe that adjusted EBITDA provides useful information on our ability to service our long-term debt and other fixed obligations and on our ability to fund our expected growth with internally generated funds. Non-GAAP Measures have limitations as analytical tools, and you should not consider either of them in isolation, or as a substitute for analysis of our operating results or cash flows as reported under GAAP. Some of these limitations are:
- They do not reflect our cash expenditures, or future requirements, for capital expenditures or contractual commitments;
- They do not reflect changes in, or cash requirements for, our working capital needs;
- Adjusted EBITDA does not reflect interest expense or cash requirements necessary to service interest or principal payments on our debt;
- Although depreciation is a noncash charge, the assets being depreciated may be replaced in the future, and neither Adjusted EBITDA, adjusted net income or adjusted net income per diluted common share reflects any cash requirements for such replacements;
- They are not adjusted for all noncash income or expense items that are reflected in our statements of cash flows; and
- Other companies in our industry may calculate these measures differently than we do, limiting their usefulness as comparative measures.
| Three Months Ended | Six Months Ended | |||||||||||||||
| June 30, | June 30, | |||||||||||||||
| 2013 | 2012 | 2013 | 2012 | |||||||||||||
| (Dollars in thousands) | (Dollars in thousands) | |||||||||||||||
| (Unaudited) | (Unaudited) | |||||||||||||||
| Reconciliation of adjusted net income: | ||||||||||||||||
|
Net income attributable to Textainer Group Holdings Limited common shareholders |
$ | 48,815 | $ | 45,809 | $ | 97,149 | $ | 95,719 | ||||||||
| Adjustments: | ||||||||||||||||
| Unrealized gains on interest rate swaps and caps, net | (3,981 | ) | (1,025 | ) | (6,268 | ) | (2,073 | ) | ||||||||
|
Impact of reconciling item on net income (loss) attributable to the noncontrolling interest |
834 | (110 | ) | 909 | (130 | ) | ||||||||||
| Adjusted net income | $ | 45,668 | $ | 44,674 | $ | 91,790 | $ | 93,516 | ||||||||
| Reconciliation of adjusted net income per diluted common share: | ||||||||||||||||
|
Net income attributable to Textainer Group Holdings Limited common shareholders per diluted common share |
$ | 0.86 | $ | 0.91 | $ | 1.71 | $ | 1.90 | ||||||||
| Adjustments: | ||||||||||||||||
| Unrealized gains on interest rate swaps and caps, net | (0.07 | ) | (0.02 | ) | (0.11 | ) | (0.05 | ) | ||||||||
|
Impact of reconciling item on net income (loss) attributable to the noncontrolling interest |
0.01 | - | 0.01 | - | ||||||||||||
| Adjusted net income per diluted common share | $ | 0.80 | $ | 0.89 | $ | 1.61 | $ | 1.85 | ||||||||
| Three Months Ended | Six Months Ended | |||||||||||||||
| June 30, | June 30, | |||||||||||||||
| 2013 | 2012 | 2013 | 2012 | |||||||||||||
| (Dollars in thousands) | (Dollars in thousands) | |||||||||||||||
| (Unaudited) | (Unaudited) | |||||||||||||||
| Reconciliation of adjusted EBITDA: | ||||||||||||||||
|
Net income attributable to Textainer Group Holdings Limited common shareholders |
$ | 48,815 | $ | 45,809 | $ | 97,149 | $ | 95,719 | ||||||||
| Adjustments: | ||||||||||||||||
| Interest income | (31 | ) | (35 | ) | (69 | ) | (63 | ) | ||||||||
| Interest expense | 20,894 | 18,531 | 42,523 | 33,250 | ||||||||||||
| Realized losses on interest rate swaps and caps, net | 2,089 | 2,529 | 4,479 | 5,079 | ||||||||||||
| Unrealized gains on interest rate swaps and caps, net | (3,981 | ) | (1,025 | ) | (6,268 | ) | (2,073 | ) | ||||||||
| Income tax expense | 2,240 | 4,122 | 6,781 | 6,445 | ||||||||||||
| Net income (loss) attributable to the noncontrolling interest | 2,025 | (687 | ) | 3,507 | (1,134 | ) | ||||||||||
| Depreciation expense | 33,833 | 22,801 | 66,516 | 44,381 | ||||||||||||
| Amortization expense | 1,088 | 1,299 | 2,175 | 2,605 | ||||||||||||
|
Impact of reconciling items on net income (loss) attributable to the noncontrolling interest |
(745 | ) | (646 | ) | (2,026 | ) | (1,157 | ) | ||||||||
| Adjusted EBITDA | $ | 106,227 | $ | 92,698 | $ | 214,767 | $ | 183,052 | ||||||||
| Net cash provided by operating activities | $ | 137,052 | $ | 108,525 | ||||||||||||
| Adjustments: | ||||||||||||||||
| Bad debt expense, net | (2,487 | ) | (2,461 | ) | ||||||||||||
| Amortization of debt issuance costs | (5,985 | ) | (6,370 | ) | ||||||||||||
| Amortization of acquired net below market leases | - | 33 | ||||||||||||||
| Amortization of deferred revenue | 970 | 4,532 | ||||||||||||||
|
Amortization of unearned income on direct financing and sales-type leases |
10,679 | 5,407 | ||||||||||||||
| Gains on sale of containers, net | 15,123 | 19,451 | ||||||||||||||
| Share-based compensation expense | (2,557 | ) | (4,190 | ) | ||||||||||||
| Interest income | (69 | ) | (63 | ) | ||||||||||||
| Interest expense | 42,523 | 33,250 | ||||||||||||||
| Realized losses on interest rate swaps and caps, net | 4,479 | 5,079 | ||||||||||||||
| Income tax expense | 6,781 | 6,445 | ||||||||||||||
| Changes in operating assets and liabilities | 10,284 | 14,571 | ||||||||||||||
|
Impact of reconciling items on net income (loss) attributable to the noncontrolling interest |
(2,026 | ) | (1,157 | ) | ||||||||||||
| Adjusted EBITDA | $ | 214,767 | $ | 183,052 | ||||||||||||
Source:
Textainer Group Holdings Limited
Hilliard C. Terry, III, +1
415-658-8214
Executive Vice President and Chief Financial Officer
ir@textainer.com