
HAMILTON, Bermuda, Feb 21, 2008 (BUSINESS WIRE) -- Textainer Group Holdings Limited (NYSE:TGH) (“Textainer”), the world’s largest lessor of intermodal containers based on fleet size, today reported results for the fourth quarter and the year ended December 31, 2007.
Total revenues for the quarter increased by $12.9 million, or 22%, to $70.6 million compared to $57.7 million in the prior year quarter primarily due to an increase in trading container sales proceeds of $9.6 million, or 377%, to $12.2 million compared to $2.6 million in the prior year quarter. EBITDA(1) for the quarter increased by $5.1 million, or 14%, to $41.2 million compared to $36.1 million in the prior year quarter.
Net income for the quarter was $15.0 million, which was a decrease of $2.0 million, or 12%, compared to $17.1 million in the prior year quarter. Textainer recorded $3.8 million more in unrealized losses on interest rate swaps, net in the fourth quarter of 2007 compared to the prior year quarter. Excluding this non-cash, non-operating item(1) Textainer’s net income would have increased 6% from $17.3 million in the fourth quarter of 2006 to $18.4 million in the fourth quarter of 2007. Textainer’s net income per diluted common share decreased by $0.12 per share, or 27%, to $0.32 per share for the fourth quarter of 2007 from $0.44 per share in the prior year quarter. The decrease in Textainer’s net income per diluted common share was partly due to the increase in Textainer’s weighted average number of shares outstanding for the fourth quarter of 2007 as a result of the additional shares issued in Textainer’s initial public offering in that quarter.
Total revenues for the year ended December 31, 2007 increased by $29.3 million, or 13%, to $255.8 million compared to $226.5 million for the year ended December 31, 2006. EBITDA(1) for the year ended December 31, 2007 increased by $21.6 million, or 16%, to $154.0 million compared to $132.4 million for the year ended December 31, 2006.
Net income for the year ended December 31, 2007 was $67.7 million, which was an increase of $11.4 million, or 20%, compared to $56.3 million for the prior year. Textainer recorded $7.7 million more in unrealized losses on interest rate swaps, net in the year ended December 31, 2007 compared to the prior year. Excluding this non-cash, non-operating item(1), Textainer’s net income would have increased $16.6 million, or 29%, from $56.7 million in 2006 to $73.3 million in 2007. Textainer’s net income per diluted common share increased by $0.20 per share, or 14%, to $1.66 per share for the year ended December 31, 2007 compared to $1.46 per share for the year ended December 31, 2006. Textainer’s net income for the year ended December 31, 2007 included a gain on disposal of $4.6 million that was recorded in the third quarter due to the reported loss by the U.S. military of approximately 28,000 on-lease containers. The U.S. military may report additional losses in the future, but we do not expect such losses, if any, to be of such a significant number of containers.
“I am very pleased with our 2007 fourth quarter and full year results. Overall demand for our containers through December was strong. Textainer’s utilization continued to remain above 93% during the fourth quarter of 2007,“ commented John A. Maccarone, President and CEO of Textainer.
He continued, “Our container resale segment had the best quarter in its history. Full year resale income before taxes of $10.3 million exceeded last year’s record results by $4.8 million, or 89%, compared to $5.5 million in the prior year.“
“For us, the major event in the fourth quarter was our initial public offering in October which allowed us to raise approximately $138 million, net of underwriting discounts and offering expenses. We used a portion of the proceeds to repay approximately $56 million that we had previously borrowed under our secured debt facility to fund our purchase of the exclusive rights to manage the approximately 500,000 TEU container fleet of Capital Lease, a competitor. We also used a portion of the proceeds to purchase, for $71 million, additional shares of Textainer Marine Containers Limited (TMCL), representing 50% of the shares formerly owned by Fortis Bank, our joint venture partner. For many years one of our primary goals has been to increase the size of our owned container fleet, which is now 40% of our total fleet of over 2 million TEU. We believe the return earned on investments in containers remains very attractive. The TMCL transaction was a significant step toward achieving this goal.“
Outlook
The initial outlook for 2008 is somewhat complex due to forecasts of lower GDP growth in many countries, including China. Lower China export growth in 2008 would reflect lower demand for imports in both North America and the European Union, and would also impact intra-Asia trade. There is also uncertainty about freight rates due to the large number of new vessels forecasted to enter service this year. If freight rates decline, and liner profitability weakens, there is a good chance that Textainer’s customers may decide to lease a larger portion of their total container requirements in 2008 than in the previous three years. The cost of borrowing is also increasing and some shipping lines may even find that their ability to borrow, regardless of cost, has been reduced. This is another reason which may cause shipping lines to lease a larger portion of their total container requirements in 2008.
Management believes that Textainer is well positioned to win a significant share of leased container opportunities in 2008 due to Textainer’s access to competitively priced capital, and container buying power. Textainer has already ordered 39,600 TEU of new containers for first quarter 2008 delivery. Management also believes that limited access to credit for some lessors may present acquisition opportunities for Textainer.
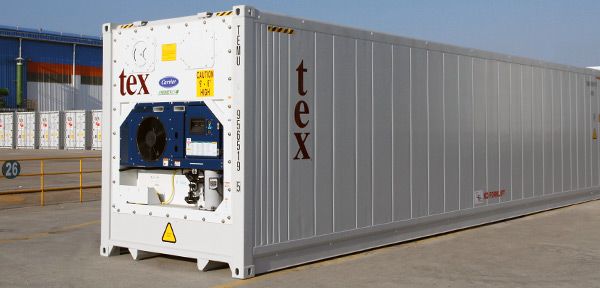
As we announced on January 3, 2008, Textainer re-entered the refrigerated container market, which we had exited in the 1990’s, because we perceive conditions in that market to now be favorable. Management believes that it can place at least $30 million worth of refrigerated containers into service on long term leases in 2008, which would increase Textainer’s capital expenditures by about 10% above its original budget. Textainer already has sales/marketing and operations/technical expertise in-house, and refrigerated containers are leased by our existing customer base, which is supported by Textainer’s current sales team. Therefore, the incremental overhead costs to Textainer for entering and operating in this market are expected to be minimal.
Textainer also expects that its Resale Division will continue to experience attractive pricing and relatively high sales volumes.
Dividend
On February 20, 2008, Textainer’s board of directors approved and declared a quarterly cash dividend of $0.21 per share on Textainer’s issued and outstanding common shares, payable on March 10, 2008 to shareholders of record as of March 3, 2008. This is an increase of $0.01 per share, or 5%, from the third quarter 2007 cash dividend of $0.20 per share.
Investors’ Webcast
Textainer will hold a conference call and a Webcast at 2:00 p.m. EST on Friday February 22, 2008 to discuss Textainer’s fiscal fourth quarter 2007 and full year results. An archive of the Webcast will be available one hour after the live call through February 22, 2008. The dial-in number for the conference call is 1-877-675-4757; outside the U.S. call 1-719-325-4930. To access the live Webcast or archive, please visit Textainer’s website at http://www.textainer.com.
About Textainer Group Holdings Limited
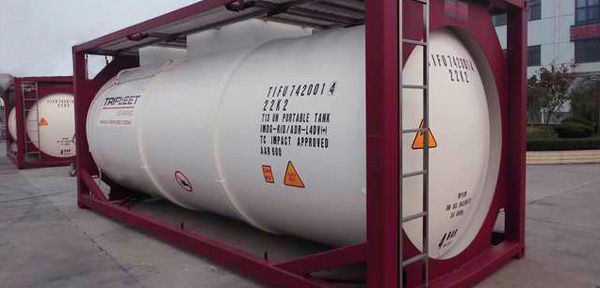
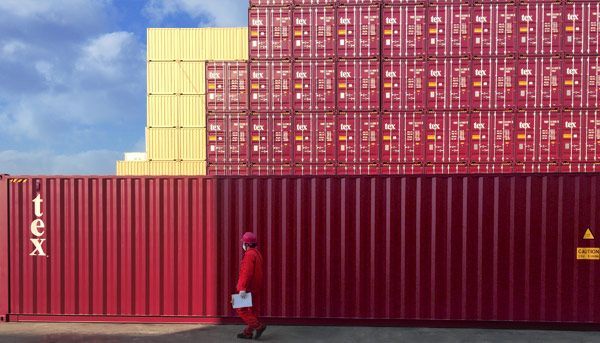
Textainer has operated since 1979 and is the world’s largest lessor of intermodal containers based on fleet size. We have a total of more than 1.3 million containers, representing over 2,000,000 twenty-foot equivalent units (TEU), in our owned and managed fleet. We lease containers to more than 400 shipping lines and other lessees. We principally lease dry freight containers, which are by far the most common of the three principal types of intermodal containers. We have also been one of the largest purchasers of new containers among container lessors over the last 10 years. We believe we are also one of the largest sellers of used containers, having sold an average of more than 50,000 containers per year for the last five years. We provide our services worldwide via a network of 14 regional and area offices and over 350 independent depots in more than 130 locations.
Important Cautionary Information Regarding Forward-Looking Statements
This press release contains forward-looking statements within the meaning of U.S. securities laws. Forward-looking statements include statements that are not statements of historical facts and include, without limitation, statements (i) that the return earned on investments in containers remains very attractive, (ii) that Textainer is on track to purchase more than the 39,600 TEU of new containers that Textainer has already ordered, (iii) that the U.S. military may report additional losses in the future, but management does not expect such losses, if any, to be of such a significant number of containers, (iv) Textainer is well positioned to win a significant share of leased container opportunities in 2008, (v) limited access to credit for some lessors may present acquisition opportunities for Textainer, (vi) Textainer can place at least $30 million worth of refrigerated containers into service on long term leases in 2008, (vii) regarding the expected incremental overhead costs for entering and operating in the refrigerated container market and (viii) regarding Textainer’s expectations for its Resale Division. Readers are cautioned that these forward-looking statements involve risks and uncertainties, are only predictions and may differ materially from actual future events or results. These risks and uncertainties include that gains and losses associated with the disposition of equipment may fluctuate; Textainer’s ability to finance continued purchase of containers; the demand for leased containers depends on many political and economic factors beyond Textainer’s control; lease and freight rates may decline; the demand for leased containers is partially tied to international trade; Textainer faces extensive competition in the container leasing industry; and the international nature of the container shipping industry exposes Textainer to numerous risks. For a discussion of such risks and uncertainties, see “Risk Factors” in Textainer’s final prospectus relating to Textainer’s initial public offering dated October 9, 2007 and filed with the Securities and Exchange Commission on October 11, 2007 and Form 6-K for the quarter ended September 30, 2007 and filed with the Securities and Exchange Commission on November 19, 2007.
Textainer’s views, estimates, plans and outlook as described within this document may change subsequent to the release of this statement. Textainer is under no obligation to modify or update any or all of the statements it has made herein despite any subsequent changes Textainer may make in its views, estimates, plans or outlook for the future.
          TEXTAINER GROUP HOLDINGS LIMITED AND SUBSIDIARIES
                     Consolidated Balance Sheets
                      December 31, 2007 and 2006
                             (Unaudited)
    (All currency expressed in United States dollars in thousands)
                                                    2007       2006
                                                 ----------- ---------
                     Assets
Current assets:
  Cash and cash equivalents                      $   69,447  $ 41,163
  Accounts receivable, net of allowance for
   doubtful accounts of $3,160 and $2,320 in
   2007 and 2006, respectively                       44,688    41,348
  Net investment in direct financing and sales-
   type leases                                        9,116     6,182
  Containers held for resale                          3,798     3,964
  Prepaid expenses                                    2,527     2,009
  Deferred taxes                                        352     3,234
  Due from affiliates, net                                9        15
                                                 ----------- ---------
     Total current assets                           129,937    97,915
Restricted cash                                      16,742    21,989
Containers, net                                     856,874   763,612
Net investment in direct financing and sales-
 type leases                                         48,075    36,040
Fixed assets, net                                     1,230     1,340
Intangible assets, net                               72,646    17,960
Interest rate swaps                                     127     4,172
Other assets                                          2,715     4,239
                                                 ----------- ---------
     Total assets                                $1,128,346  $947,267
                                                 =========== =========
      Liabilities and Shareholders’ Equity
Current liabilities:
  Accounts payable                               $    4,612  $  4,618
  Accrued expenses                                   11,115    13,167
  Container contracts payable                        28,397    32,927
  Due to owners, net                                 18,019     6,570
  Secured debt facility                               6,585        --
  Bonds payable                                      58,000    58,000
                                                 ----------- ---------
     Total current liabilities                      126,728   115,282
Revolving credit facility                            21,500        --
Secured debt facility                               124,391    53,000
Bonds payable                                       370,938   430,167
Interest rate swaps                                   4,409       180
Long-term income tax payable, net                    15,733     7,912
Deferred taxes                                       10,814    13,510
                                                 ----------- ---------
     Total liabilities                              674,513   620,051
                                                 ----------- ---------
Minority interest                                    49,717    85,922
                                                 ----------- ---------
Shareholders’ equity:
Common shares, $0.01 par value. Authorized
 140,000,000 shares; issued and outstanding
 47,604,640 and 38,274,640 shares at 2007 and
 2006, respectively                                     476       383
Additional paid-in capital                          163,753    24,093
Notes receivable from shareholders                     (432)   (1,180)
Accumulated other comprehensive income                  579       380
Retained earnings                                   239,740   217,618
                                                 ----------- ---------
     Total shareholders’ equity                     404,116   241,294
                                                 ----------- ---------
     Total liabilities and shareholders’ equity  $1,128,346  $947,267
                                                 =========== =========
          TEXTAINER GROUP HOLDINGS LIMITED AND SUBSIDIARIES
                  Consolidated Statements of Income
       Three Months and Years Ended December 31, 2007 and 2006
                             (Unaudited)
(All currency expressed in United States dollars in thousands, except
                          per share amounts)


                               Three months ended      Years ended
                                  December 31,        December 31,
                               ------------------- -------------------
                                 2007       2006     2007      2006
                               ---------  -------- --------- ---------
 Revenues:
   Lease rental income         $ 47,119   $47,406  $192,342  $186,093
   Management fees                7,587     4,871    24,125    16,194
   Trading container sales
    proceeds                     12,182     2,554    25,497    14,137
   Gain on sale of containers,
    net                           3,749     2,735    13,544     9,558
   Other, net                        (6)      152       284       480
                               --------   -------  --------  --------
         Total revenues          70,631    57,718   255,792   226,462
                               --------   -------  --------  --------
 Operating expenses:
   Direct container expense       6,539     7,309    32,895    29,757
   Cost of trading containers
    sold                         10,206     1,986    20,753    11,480
   Depreciation expense          12,861    10,934    48,757    54,330
   Amortization expense           1,699       565     3,677     1,023
   General and administrative
    expense                       5,335     3,902    18,063    15,870
   Short-term incentive
    compensation expense          1,037     1,725     4,094     4,694
   Long-term incentive
    compensation expense            912        69       932       285
   Bad debt expense, net           (156)      (73)    1,133       664
                               --------   -------  --------  --------
         Total operating
          expenses               38,433    26,417   130,304   118,103
                               --------   -------  --------  --------
         Income from
          operations             32,198    31,301   125,488   108,359
                               --------   -------  --------  --------
 Other income (expense):
   Interest expense              (9,716)   (8,869)  (37,094)  (33,083)
   Interest income                1,299       651     3,422     2,286
   Realized gains on interest
    rate swaps, net                 492       900     3,204     2,848
   Unrealized losses on
    interest rate swaps, net     (4,197)     (363)   (8,274)     (574)
   Gain on disposal of lost
    military containers, net          -         -     4,639         -
   Other, net                        97       411        56       243
                               --------   -------  --------  --------
         Net other expense      (12,025)   (7,270)  (34,047)  (28,280)
                               --------   -------  --------  --------
         Income before income
          tax and minority
          interest               20,173    24,031    91,441    80,079
                               --------   -------  --------  --------
 Income tax expense              (2,169)   (1,349)   (6,847)   (4,299)
 Minority interest expense       (2,960)   (5,607)  (16,926)  (19,499)
                               --------   -------  --------  --------
         Net income            $ 15,044   $17,075  $ 67,668  $ 56,281
                               ========   =======  ========  ========
 Net income per share:
   Basic                       $   0.32   $  0.45  $   1.66  $   1.47
   Diluted                     $   0.32   $  0.44  $   1.66  $   1.46
 Weighted average shares
  outstanding (in thousands):
   Basic                         47,605    38,255    40,800    38,186
   Diluted                       47,605    38,503    40,841    38,488
          TEXTAINER GROUP HOLDINGS LIMITED AND SUBSIDIARIES
                Consolidated Statements of Cash Flows
                Years Ended December 31, 2007 and 2006
                             (Unaudited)
    (All currency expressed in United States dollars in thousands)
                                                    2007       2006
                                                 ---------- ----------
Cash flows from operating activities:
   Net income                                    $  67,668  $  56,281
                                                 ---------- ----------
   Adjustments to reconcile net income to net
    cash provided by operating activities:
      Depreciation expense                          48,757     54,330
      Provision for containers held for resale           2         (1)
      Bad debt expense, net                          1,133        664
      Unrealized losses on interest rate swaps,
       net                                           8,274        574
      Amortization of debt issuance costs            1,395      1,405
      Amortization of intangible assets              3,677      1,023
      Gains on sale of containers and disposal
       of lost military containers, net            (18,183)    (9,558)
      Long-term incentive compensation expense         911        285
      Minority interest expense                     16,926     19,499
      Decrease (increase) in:
         Accounts receivable, net                   (4,473)       215
         Containers held for resale                    702        334
         Prepaid expenses                             (411)     1,293
         Due from affiliates, net                        6         36
         Other assets                                 (383)    (1,280)
      (Decrease) increase in:
         Accounts payable                               (6)    (3,153)
         Accrued expenses                           (1,357)    (8,020)
         Due to owners, net                         11,449        559
         Long-term income tax payable, net           7,821      7,912
         Deferred taxes, net                           526      1,030
                                                 ---------- ----------
             Total adjustments                      76,766     67,147
                                                 ---------- ----------
             Net cash provided by operating
              activities                           144,434    123,428
                                                 ---------- ----------
Cash flows from investing activities:
   Purchase of additional shares of Textainer
    Marine Containers Ltd                          (71,131)         -
   Purchase of containers and fixed assets        (207,171)  (104,818)
   Purchase of intangible assets                   (56,000)   (18,983)
   Proceeds from sale of containers and fixed
    assets                                          70,200     34,142
   Receipt of principal payments on direct
    finance and sales-type leases                    7,594      6,456
                                                 ---------- ----------
             Net cash used in investing
              activities                          (256,508)   (83,203)
                                                 ---------- ----------
Cash flows from financing activities:
   Proceeds from revolving credit facility          49,500          -
   Principal payments on revolving credit
    facility                                       (28,000)         -
   Proceeds from secured debt facility             236,000     74,000
   Principal payments on secured debt facility    (157,300)   (21,000)
   Principal payments on bonds payable             (58,000)   (58,000)
   Decrease (increase) in restricted cash            5,247     (8,610)
   Debt issuance costs                                (297)    (1,339)
   Initial public offering costs                    (2,905)         -
   Issuance of common shares                       140,872         56
   Repayments of notes receivable from
    shareholders                                     1,623        658
   Retirement of common shares                           -        (97)
   Dividends paid                                  (46,581)   (27,311)
                                                 ---------- ----------
             Net cash provided by (used in)
              financing activities                 140,159    (41,643)
                                                 ---------- ----------
Effect of exchange rate changes                        199        350
                                                 ---------- ----------
             Net increase (decrease) in cash and
              cash equivalents                      28,284     (1,068)
Cash and cash equivalents, beginning of the year    41,163     42,231
                                                 ---------- ----------
Cash and cash equivalents, end of the year       $  69,447  $  41,163
                                                 ========== ==========
Supplemental disclosures of cash flow
 information:
   Cash paid during the year for:
     Interest                                    $  32,478  $  28,812
     Income taxes                                $     850  $     981
Supplemental disclosures of noncash investing
 activities:
   (Decrease) increase in accrued container
    purchases                                    $  (4,530) $  30,373
   Containers placed in direct finance leases    $  23,488  $  15,667
          TEXTAINER GROUP HOLDINGS LIMITED AND SUBSIDIARIES
Non-GAAP Reconciliation of Net Income to EBITDA and Net Income to Net
    Income Excluding Unrealized Losses on Interest Rate Swaps, Net
       Three Months and Years Ended December 31, 2007 and 2006
                             (Unaudited)
(All currency expressed in United States dollars in thousands, except
                          per share amounts)
(1) The following is a reconciliation of net income to EBITDA and a
 reconciliation of net income to net income excluding unrealized
 losses on interest rate swaps, net for the three months and years
 ended December 31, 2007 and 2006.  EBITDA (defined as net income,
 before interest income and interest expense, realized and unrealized
 (gains) losses on interest rate swaps, net, income tax expense,
 minority interest expense and depreciation and amortization expense)
 and net income excluding unrealized losses on interest rate swaps,
 net (defined as net income, before unrealized losses on interest rate
 swaps, net and the related impact on income tax expense and minority
 interest expense) are not financial measures calculated in accordance
 with U.S. generally accepted accounting principles (“GAAP”) and
 should not be considered as an alternative to net income, income from
 operations or any other performance measures derived in accordance
 with GAAP or as an alternative to cash flows from operating
 activities as a measure of our liquidity.  EBITDA and net income
 excluding unrealized losses on interest rate swaps, net are presented
 solely as supplemental disclosures.  Management believes that EBITDA
 may be a useful performance measure that is widely used within our
 industry.  EBITDA is not calculated in the same manner by all
 companies and, accordingly, may not be an appropriate measure for
 comparison.  Management also believes that net income excluding
 unrealized losses on interest rate swaps, net is useful in evaluating
 our operating performance because unrealized losses on interest rate
 swaps, net is a non-cash, non-operating item.  We believe EBITDA and
 net income excluding unrealized losses on interest rate swaps, net
 both provide useful information on our earnings from ongoing
 operations.  We believe that EBITDA provides useful information on
 our ability to service our long-term debt and other fixed obligations
 and on our ability to fund our continued growth with internally
 generated funds.  EBITDA and net income excluding unrealized losses
 on interest rate swaps, net have limitations as analytical tools, and
 you should not consider either of them in isolation, or as a
 substitute for analysis of our operating results or cash flows as
 reported under GAAP.  Some of these limitations are:
-- They do not reflect our cash expenditures, or future requirements,
 for capital expenditures or contractual commitments;
-- They do not reflect changes in, or cash requirements for, our
 working capital needs;
-- EBITDA does not reflect interest expense or cash requirements
 necessary to service interest or principal payments on our debt;
-- Although depreciation is a non-cash charge, the assets being
 depreciated may be replaced in the future, and neither EBITDA or net
 income excluding unrealized losses on interest rate swaps, net
 reflects any cash requirements for such replacements;
-- They are not adjusted for all non-cash income or expense items that
 are reflected in our statements of cash flows; and
-- Other companies in our industry may calculate these measures
 differently than we do, limiting their usefulness as comparative
 measures.
----------------------------------------------------------------------
                                Three Months Ended    Years Ended
                                    December 31        December 31
----------------------------------------------------------------------
                                  2007      2006     2007      2006
----------------------------------------------------------------------
Reconciliation of EBITDA:
----------------------------------------------------------------------
Net income                      $ 15,044  $17,075  $ 67,668  $ 56,281
----------------------------------------------------------------------
Adjustments:
----------------------------------------------------------------------
  Interest income                 (1,299)    (651)   (3,422)   (2,286)
----------------------------------------------------------------------
  Interest expense                 9,716    8,869    37,094    33,083
----------------------------------------------------------------------
  Realized gains on interest
   rate swaps, net                  (492)    (900)   (3,204)   (2,848)
----------------------------------------------------------------------
  Unrealized losses on interest
   rate swaps, net                 4,197      363     8,274       574
----------------------------------------------------------------------
  Income tax expense               2,169    1,349     6,847     4,299
----------------------------------------------------------------------
  Minority interest expense        2,960    5,607    16,926    19,499
----------------------------------------------------------------------
  Depreciation expense            12,861   10,934    48,757    54,330
----------------------------------------------------------------------
  Amortization expense             1,699      565     3,677     1,023
----------------------------------------------------------------------
  Impact of reconciling items
   on minority interest expense   (5,677)  (7,069)  (28,595)  (31,598)
--------------------------------=========-========-=========-=========
EBITDA                          $ 41,178  $36,142  $154,022  $132,357
--------------------------------=========-========-=========-=========
Reconciliation of net income
 excluding unrealized losses on
 interest rate swaps, net:
----------------------------------------------------------------------
Net income                      $ 15,044  $17,075  $ 67,668  $ 56,281
----------------------------------------------------------------------
Adjustments:
----------------------------------------------------------------------
Unrealized losses on interest
 rate swaps, net                   4,197      363     8,274       574
----------------------------------------------------------------------
  Income tax expense                   -        -         -         -
----------------------------------------------------------------------
  Minority interest Expense         (862)    (152)   (2,594)     (151)
--------------------------------=========-========-=========-=========
Net income excluding unrealized
 losses on interest rate swaps,
 net                            $ 18,379  $17,286  $ 73,348  $ 56,704
--------------------------------=========-========-=========-=========
SOURCE: Textainer Group Holdings Limited
Textainer Group Holdings Limited
Mr. Tom Gallo, 415-658-8227
Corporate Compliance Officer
ir@textainer.com
Copyright Business Wire 2008
News Provided by COMTEX